atc2met Data Publication Web Site
1 Introduction
atc2met, short for Air-Traffic-Control radio-communication to METeorological data, is a comprehensive system for observation, data processing, and data publication of meteorological data derived from the radio communication for air-traffic control based on the Secondary Surveillance Radar (SSR) Mode-S.
1.1 Current status of atc2met system
atc2met is still at development stage. Published data are for preliminary usage.
2 Measurement Techniques
SSR meteorological measurement technique is introduced by Vû et al. in 2018. Here, we briefly review on the procedure.
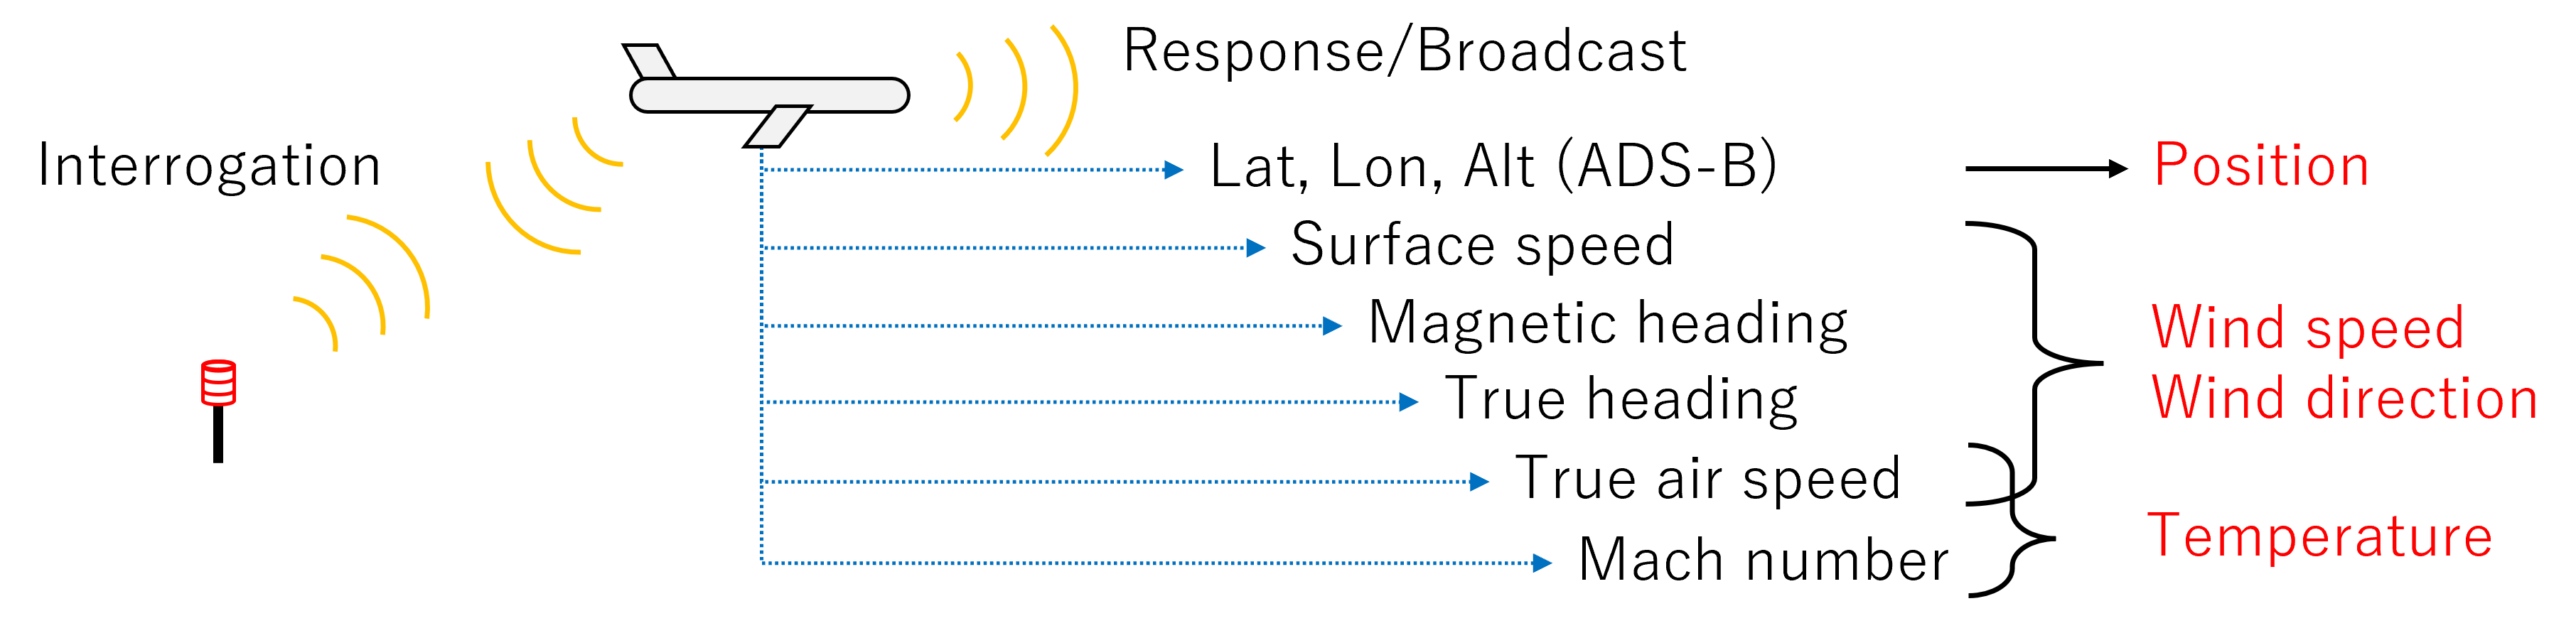
Commercial aircrafts measure information about the surrounding atmosphere for their navigation purpose. When an interrogation signal is transmitted from the ground station, corresponding response is transmitted in downlink format via SSR Mode-S. We can also receive these signals and reconstruct meteorological information around aircraft by applying appropriate inverse transformations.
Figure 1 describes the observable meteorological variables and corresponding messages in SSR Mode-S downlink format. Positions are obtained from Automatic Dependent Surveillance–Broadcast (ADS-B).
2.1 SSR Mode-S/ADS-B signal
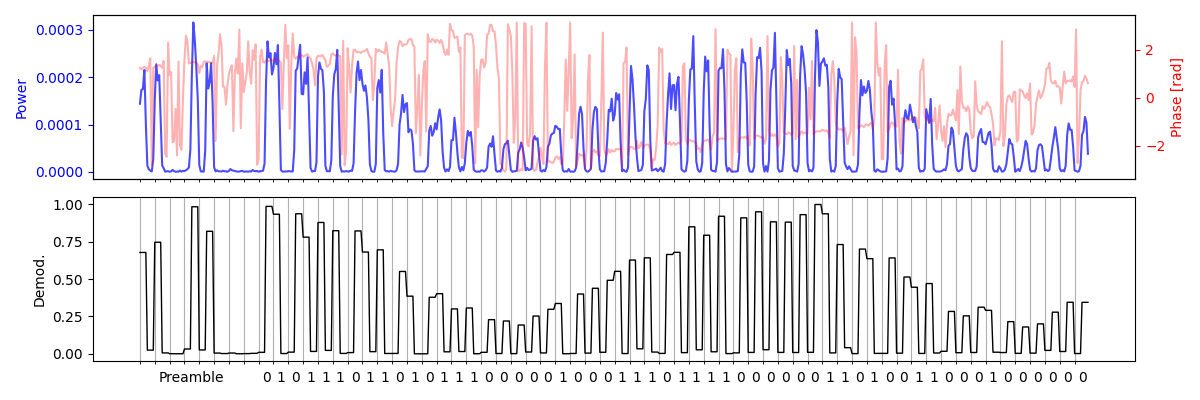
Secondary Surveillance Radar (SSR) Mode-S is a relatively new standard of a radio communication protocol used for the air traffic control. We overview the specifications of this protocol in Table 1. Note this table only refers to the reception; transmission for interrogation is on different frequency (1030 MHz). Figure 2 shows an example waveform and demodulated bits of SSR Mode-S signal DF = 11 (All-call Reply).
| Tx Frequency | \(\mathsf{1090\,MHz}\) |
| Tx Bandwidth | \(\mathsf{\pm 3\,MHz}\) |
| Modulation | Pulse position modulation |
| Baud rate | \(\mathsf{1\,Mbps}\) |
| Rx Bandwidth | \(\mathsf{8.1\,MHz}\) |
2.1.1 Decoding procedure
SSR Mode-S and ADS-B uses the pulse position modulation at 1 Mbps baud rate. Hence, the minimum sampling rate for the receiver is 2 Mbps. Decoding procedure is as follows:
- Search the preamble (fixed pattern, first 8 us) to determin the start point of the data bits,
- Determin the pulse position for each successive microsecond bin. When a pulse is ahead or behind of the center of each 1us bin, 1 or 0 is assigned for each bit,
- Decode the downlink format (DF) from the first 2 or 5 bits as integers. The length of the data bits is also obtained according to the downlink format, as in Table 2,
- Try demodulate all bits. DF = 11 and 17 contains the identifier of the aircraft (ICAO Address,) which will be saved for the further processing.
- Check the validity of the message using the last 24 bits, which contains the Cyclic Redundancy Check (CRC) value of the other bits of data block. For DF other than 11 or 17, the CRC is XOR-ed with ICAO Address, so we need to try all known ICAO Address first by taking XOR again, because:
\[ \left( \mathrm{CRC} \oplus \mathrm{ICAO} \right) \oplus \mathrm{ICAO} = \mathrm{CRC} \]
| DF | Bits |
|---|---|
| 0, 4, 11 | 56 |
| 17, 20, 21 | 112 |
2.1.2 Messages of our interest
Among various downlink format of SSR Mode-S and ADS-B, messages in Table 3 are particularly important for SSR meteorological measurement. Positions, wind field, and temperature are computed from these messages.
| DF | TC | BDS | Contents |
|---|---|---|---|
| 4/20 | Mode-S Surveillance (Altitude) | ||
| 11 | Mode-S all call reply (ICAO Address) | ||
| 17 | 1-4 | ADS-B Aircraft Identification (Call Sign) | |
| 17 | 5-8 | ADS-B Surface Position (Latitude, Longitude, Ground Speed) | |
| 17 | 9-18/20-22 | ADS-B Airborne position (Latitude, Longitude, Altitude) | |
| 17 | 19 | ADS-B Airborne velocity (Ground Speed / Indicated Air Speed / True Air Speed) | |
| 20/21 | 2,0 | Aircraft identification (Call sign) | |
| 20/21 | 5,0 | Track and turn report (Roll angle, track angle, track rate, ground speed, true air speed) | |
| 20/21 | 6,0 | Heading and speed report (Magnetic heading, Indicated air speed, Mach number, Vertical rates) | |
| 20/21 | 4,4 | Meteorological routine air report (wind, temperature, pressure, humidity, turbulence) | |
| 20/21 | 4,5 | Meteorological hazard report (turbulence, wind shear, Microburst, Icing, Wake vortex, temperature, pressure, radio height) |
2.2 Computation of the meteorological information
2.2.1 Positions
Positions are mainly computed from ADS-B messages (DF = 17).
2.2.2 Wind field
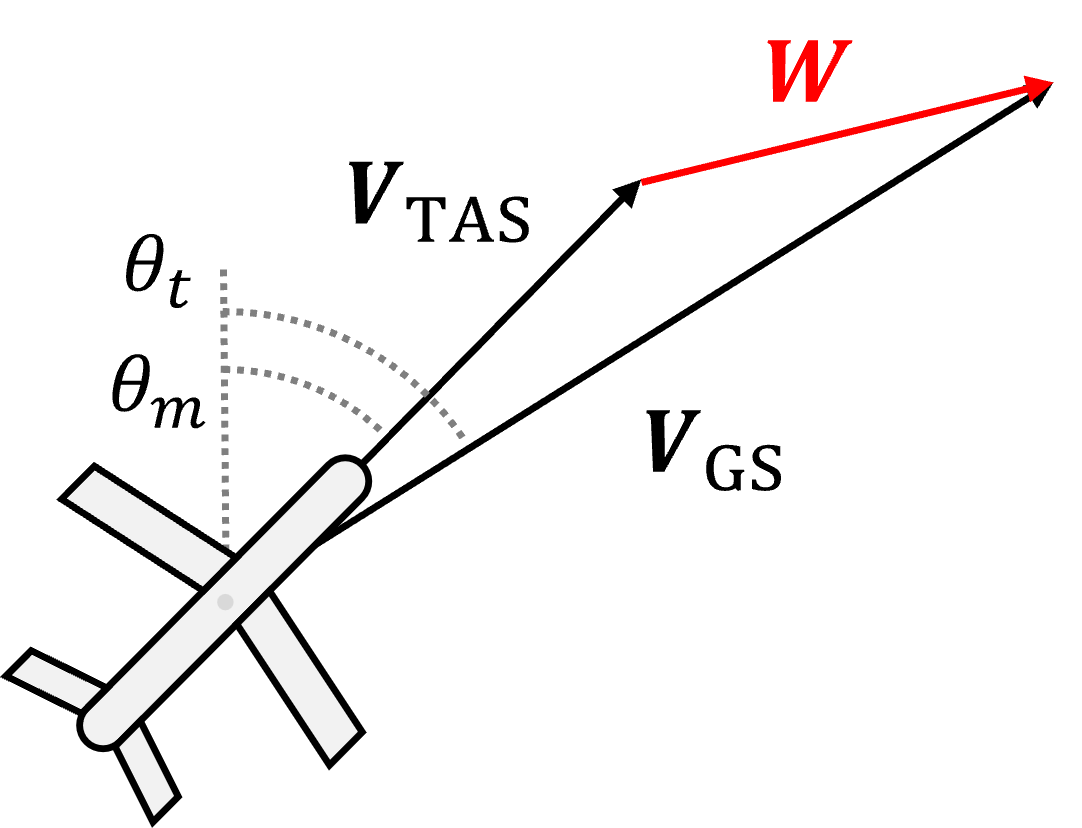
Wind fields are computed from vector difference between the ground velocity vector \(V_\mathrm{GS}\) and true air velocity vector \(V_\mathrm{TAS}\). The ground velocity vector is computed from the Ground Speed \(V_\mathrm{GS}\) and True track angle \(\theta_t\). The true air velocity vector is computed from the True Air Speed \(V_\mathrm{TAS}\) and magnetic heading \(\theta_m\). Figure 3 shows the relationships among these vectors.
2.2.3 Temperature
Temperature is estimated mainly from the True air speed \(V_\mathrm{TAS}\), Mach number \(M\), and the International Standard Air (ISA) model using following equations:
\[ p = \left\{\begin{align} p_b \left[ 1 + \frac{\lambda(h - h_b)}{T_b}\right]^{-\frac{g}{\lambda R}} & \quad & \lambda \ne 0 \nonumber\\ p_b \exp\left[ -\frac{g (h - h_b)}{RT_b}\right] & \quad & \lambda = 0 \nonumber \end{align} \right. \]
\[ \rho = \frac{p}{RT} \]
\[ T = \begin{cases} \frac{V_\mathrm{TAS}p}{V_\mathrm{IAS} \rho R} & M < 0.3 \\ \frac{V_\mathrm{TAS} T_0}{M^2 a_0^2} & M \ge 0.3 \end{cases} \]
Here, \(h_b\), \(T_b\), \(p_b\) and \(\lambda\) are the ISA layer constants as in Table 4, \(a_0\), \(g\), \(p_0\), \(R\), and \(T_0\) are the ISA constants in Table 5, \(M\) is the Mach number, \(p\) is the estimated air pressure, \(\rho\) is the estimated air density, and \(T\) is the estimated temperature.
| Layer | \(h_b\) \([\mathsf{m}]\) | \(T_b\) \([\mathsf{K}]\) | \(p_b\) \([\mathsf{Pa}]\) | \(\lambda\) \([\mathsf{K/km}]\) |
|---|---|---|---|---|
| Troposphere | 0 | 288.15 | 101325 | -6.5 |
| Tropopause | 11000 | 216.65 | 22632 | 0.0 |
| Stratosphere | 20000 | 216.65 | 5475 | 1.0 |
| Symbol | Description | Value |
|---|---|---|
| \(a_0\) | speed of sound at sea level | 340.3 m s-1 |
| \(g\) | Gravitational acceleration | 9.81 m s2 |
| \(p_0\) | Air pressure at sea level | 101.325 Pa |
| \(R\) | Air pressure at sea level | \(\mathsf{287.05\,J\left(kgK\right)^{-1}}\) |
| \(T_0\) | Temperature at sea level | \(\mathsf{288.15\,K}\) |
3 Implementation of SSR meteorological measurement
3.1 atc2met system
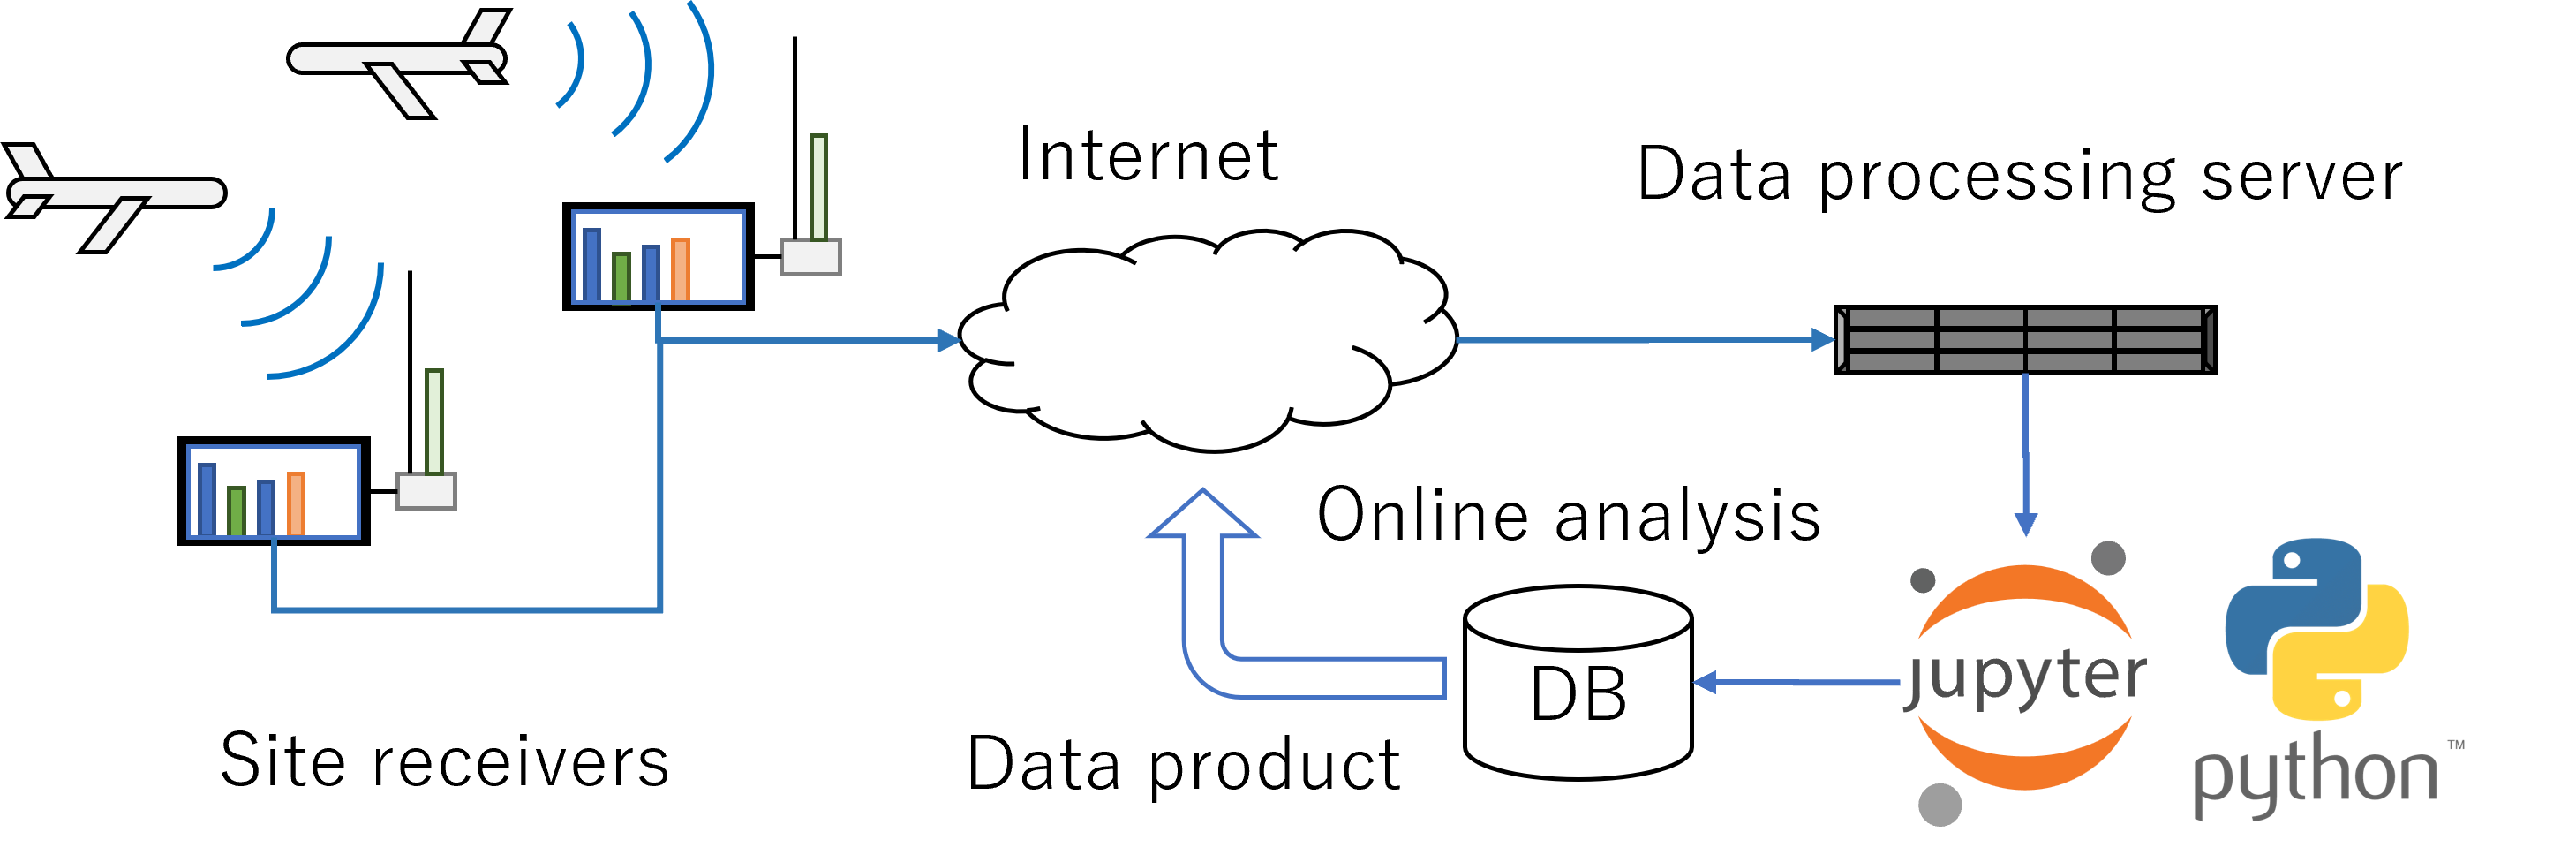
atc2met system is composed of site receivers and data processing server connected via Internet. Figure 4 shows the whole structure of the atc2met system. Site receivers receives the SSR Mode-S/ADS-B signal from commercial aircrafts and send decoded messages to the central data processing server. The message is further processed and meteorological data are reconstructed. An automatic quality control procedure is also running on the server. Data products are then published at https://atc2met.nipr.ac.jp.
3.2 Site receiver
Site receiver is designed to be small and inexpensive, aiming for easy deployment at multiple locations. The data processor is based on a single board computer (e.g., Raspberry Pi 4). Radio frequency receiver is based on the software-defined radio (SDR) architecture, supporting RTL-SDR based DVB-T dongle for digital television, HackRF One, USRP. Antennas can also be small (\(\mathsf{1090\,MHz}\) frequency \(\sim\mathsf{275\,mm}\) wavelength), like printed circuit board (PCB) type antenna. The maximum coverage of each site receiver depends on the line of sight, but roughly 300 km. Figure 5 shows each component of a site receiver.

For the demodulator/decoder software, you can use, for example, the famous dump1090 software to receive SSR Mode-S signal on a RTL-SDR platform.
For other platforms (HackRF One or USRP), we will publish a handy receiver software soon.
3.3 Data processing
Data from site receivers are gathered to the analysis server and published after appropriate quality control and some basic analysis.
3.3.1 Quality Control
Raw data from site receivers contain some errors, typically outlies with very large value or opposite sign, mainly due to the attitude of the aircrafts. Hence, the following simple quality control procedure is taken before further analysis:
- Filter aircrafts with a large roll angle ( > 30 degrees),
- Filter data within specified radius from the site (100 km),
- Compute representative values by taking the median within each bin (0.25 km x 3 minutes).
3.3.2 Data products
Data products of atc2met contains:
- Air temperature,
- Wind speed/direction,
Observable heights are roughly 0 - 12 km. Table 6 shows the resolutions of the data products.
| Resolution | Version 1.0 | Version 1.1 |
|---|---|---|
| Time | 3 min | 10 min |
| Horizontal | N/A | 20 km |
| Vertical | 0.25 km | 0.25 km |
4 Details on provided data products
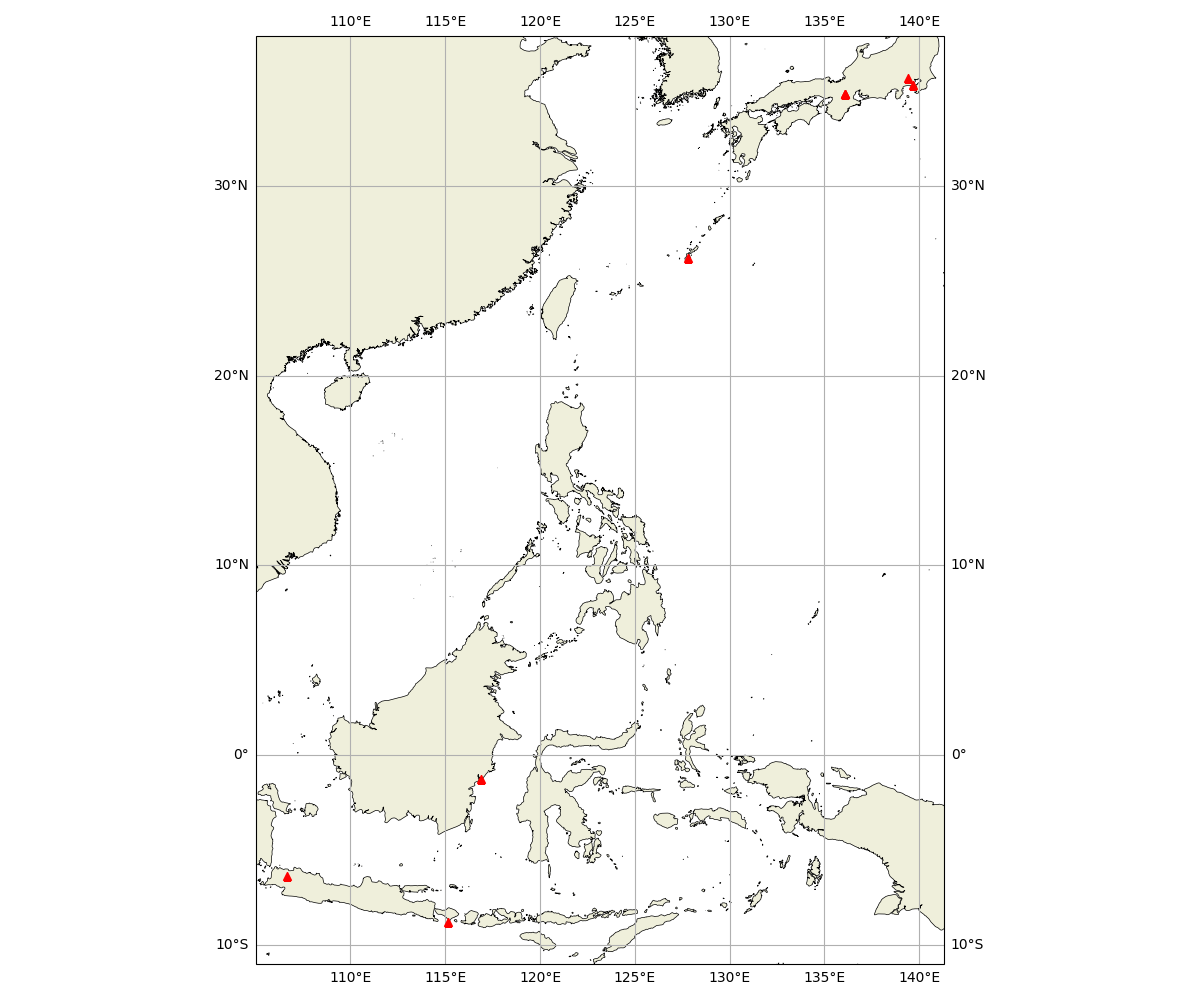
4.1 Site locations
There are currently four sites in Japan, and 3 sites in Indonesia.
4.1.1 Japan
- NIPR, Tokyo
- JAMSTEC, Kanagawa
- Shigaraki MU observatory, Shiga
- Ryukyu University, Okinawa
4.1.2 Indonesia
- Jakarta
- Denpasar
- Balikpapan
4.2 Data format
Data are in NetCDF CF format. Example data structure is as follows.
4.2.1 Version v1
Data products v1 is a height profile for each site. Structure of the data is as follows:
$ ncdump -h 20231020_10000000bde2ca07.nc
netcdf 20231020_10000000bde2ca07 {
dimensions:
        height = 49 ;
        time = 480 ;
variables:
        double height(height) ;
                height:_FillValue = NaN ;
                height:units = "m" ;
                height:positive = "up" ;
        int64 time(time) ;
                time:units = "minutes since 2023-10-20 00:00:00" ;
                time:calendar = "proleptic_gregorian" ;
        double U_5%(height, time) ;
                U_5%:_FillValue = NaN ;
                U_5%:units = "m/s" ;
                U_5%:long_name = "5% point of zonal wind" ;
        double U_25%(height, time) ;
                U_25%:_FillValue = NaN ;
                U_25%:units = "m/s" ;
                U_25%:long_name = "25% point of zonal wind" ;
        double U(height, time) ;
                U:_FillValue = NaN ;
                U:units = "m/s" ;
                U:long_name = "zonal wind" ;
        double U_75%(height, time) ;
                U_75%:_FillValue = NaN ;
                U_75%:units = "m/s" ;
                U_75%:long_name = "75% point of zonal wind" ;
        double U_95%(height, time) ;
                U_95%:_FillValue = NaN ;
                U_95%:units = "m/s" ;
                U_95%:long_name = "95% point of zonal wind" ;
        double V_5%(height, time) ;
                V_5%:_FillValue = NaN ;
                V_5%:units = "m/s" ;
                V_5%:long_name = "5% point of meridional wind" ;
        double V_25%(height, time) ;
                V_25%:_FillValue = NaN ;
                V_25%:units = "m/s" ;
                V_25%:long_name = "25% point of meridional wind" ;
        double V(height, time) ;
                V:_FillValue = NaN ;
                V:units = "m/s" ;
                V:long_name = "meridional wind" ;
        double V_75%(height, time) ;
                V_75%:_FillValue = NaN ;
                V_75%:units = "m/s" ;
                V_75%:long_name = "75% point of meridional wind" ;
        double V_95%(height, time) ;
                V_95%:_FillValue = NaN ;
                V_95%:units = "m/s" ;
                V_95%:long_name = "95% point of meridional wind" ;
        double T_5%(height, time) ;
                T_5%:_FillValue = NaN ;
                T_5%:units = "degree_Celsius" ;
                T_5%:long_name = "5% point of temperature" ;
        double T_25%(height, time) ;
                T_25%:_FillValue = NaN ;
                T_25%:units = "degree_Celsius" ;
                T_25%:long_name = "25% point of temperature" ;
        double T(height, time) ;
                T:_FillValue = NaN ;
                T:units = "degree_Celsius" ;
                T:long_name = "temperature" ;
        double T_75%(height, time) ;
                T_75%:_FillValue = NaN ;
                T_75%:units = "degree_Celsius" ;
                T_75%:long_name = "75% point of temperature" ;
        double T_95%(height, time) ;
                T_95%:_FillValue = NaN ;
                T_95%:units = "degree_Celsius" ;
                T_95%:long_name = "95% point of temperature" ;

// global attributes:
                :tres_min = 3LL ;
                :hres_km = 0.25 ;
                :hmax_km = 12. ;
                :roll_max_deg = 30. ;
                :date = "2023-10-20" ;
                :site_id = "10000000bde2ca07" ;
                :site_name = "ARX01-00" ;
                :latitude = 35.3201499835854 ;
                :longitude = 139.649933649845 ;
                :radius_km = 100LL ;
                :product_version = "v1" ;
                :software_version = "0.4.1" ;
                :created_at = "2023-10-21T01:57:32.555733" ;
}
4.2.2 Version 1.1
Data products v1.1 is a voxel data of wind and temperature fields around each site. Structure of the data is as follows:
netcdf \20241116_10000000b8c270c6 {
dimensions:
        time = 144 ;
        latitude = 30 ;
        longitude = 30 ;
        height = 48 ;
variables:
        int64 time(time) ;
                time:units = "minutes since 2024-11-16 00:00:00" ;
                time:calendar = "proleptic_gregorian" ;
        double latitude(latitude) ;
                latitude:_FillValue = NaN ;
                latitude:units = "degrees_north" ;
        double longitude(longitude) ;
                longitude:_FillValue = NaN ;
                longitude:units = "degrees_east" ;
        double height(height) ;
                height:_FillValue = NaN ;
                height:units = "km" ;
                height:positive = "up" ;
        double UV_n(time, latitude, longitude, height) ;
                UV_n:_FillValue = NaN ;
                UV_n:long_name = "count for zonal/meridional winds" ;
        double U(time, latitude, longitude, height) ;
                U:_FillValue = NaN ;
                U:long_name = "zonal wind" ;
        double U_std(time, latitude, longitude, height) ;
                U_std:_FillValue = NaN ;
                U_std:long_name = "standard deviation of zonal wind" ;
        double V(time, latitude, longitude, height) ;
                V:_FillValue = NaN ;
                V:long_name = "meridional wind" ;
        double V_std(time, latitude, longitude, height) ;
                V_std:_FillValue = NaN ;
                V_std:long_name = "standard deviation of meridional wind" ;
        double T_n(time, latitude, longitude, height) ;
                T_n:_FillValue = NaN ;
                T_n:long_name = "count for temperature" ;
        double T(time, latitude, longitude, height) ;
                T:_FillValue = NaN ;
                T:long_name = "temperature" ;
        double T_std(time, latitude, longitude, height) ;
                T_std:_FillValue = NaN ;
                T_std:long_name = "standard deviation of temperature" ;

// global attributes:
                :tres_min = 10LL ;
                :hres_km = 20. ;
                :vres_km = 0.25 ;
                :hmax_km = 300LL ;
                :vmax_km = 12. ;
                :roll_max_deg = 30. ;
                :date = "2024-11-16" ;
                :site_id = "10000000b8c270c6" ;
                :site_name = "ARX01-01" ;
                :latitude = 34.8554051117419 ;
                :longitude = 136.106224764538 ;
                :radius_km = 300LL ;
                :product_version = "v1.1" ;
                :software_version = "0.5.3" ;
                :created_at = "2024-11-17T00:57:57.636870" ;
}
5 Credits
5.1 Acknowledgements
atc2met project is carried out by:
- MORI, Shuichi from Japan Agency for Marine-Earth Science and Technology (JAMSTEC),
- HASHIMOTO, Taishi from National Institute of Polar Research (NIPR), and
- MUSHIAKE, Kazuhiko from Ilohas Project Co., Ltd.
In collaboration with:
- KOGA, Tadashi and YOSHIHARA, Takayuki from Electronic Navigation Research Institute (ENRI)
The project is supported by:
- JSPS KAKENHI Grant-in-Aid for Challenging Research (Exploratory) (Grant Number JP20K21852),
- Sumitomo Foundation Fiscal 2022 Grant For Environmental Research Projects (Grant Number 2230208), and
- Strategic Research Projects grant from ROIS (Research Organization of Information and Systems) (Project Number 2022-SRP-05).
5.2 Contact
If you want to use data provided here, please let me know so that I can provide more information about the data product.
5.2.1 橋本 大志 (Taishi Hashimoto)
hashimoto.taishi[at]nipr.ac.jp (replace [at] to @)
6 References
- Vû et al., ADS-B and Mode S Data for Aviation Meteorology and Aircraft Performance Modelling, 2018.
- Sun, Junzi, The 1090 Megahertz Riddle: A Guide to Decoding Mode S and ADS-B Signals, TU Delft OPEN Publishing, 2021, doi:https://doi.org/10.34641/mg.11.
- junzis/pyModeS, https://github.com/junzis/pyModeS.
- antirez/dump1090, GitHub, https://github.com/antirez/dump1090.